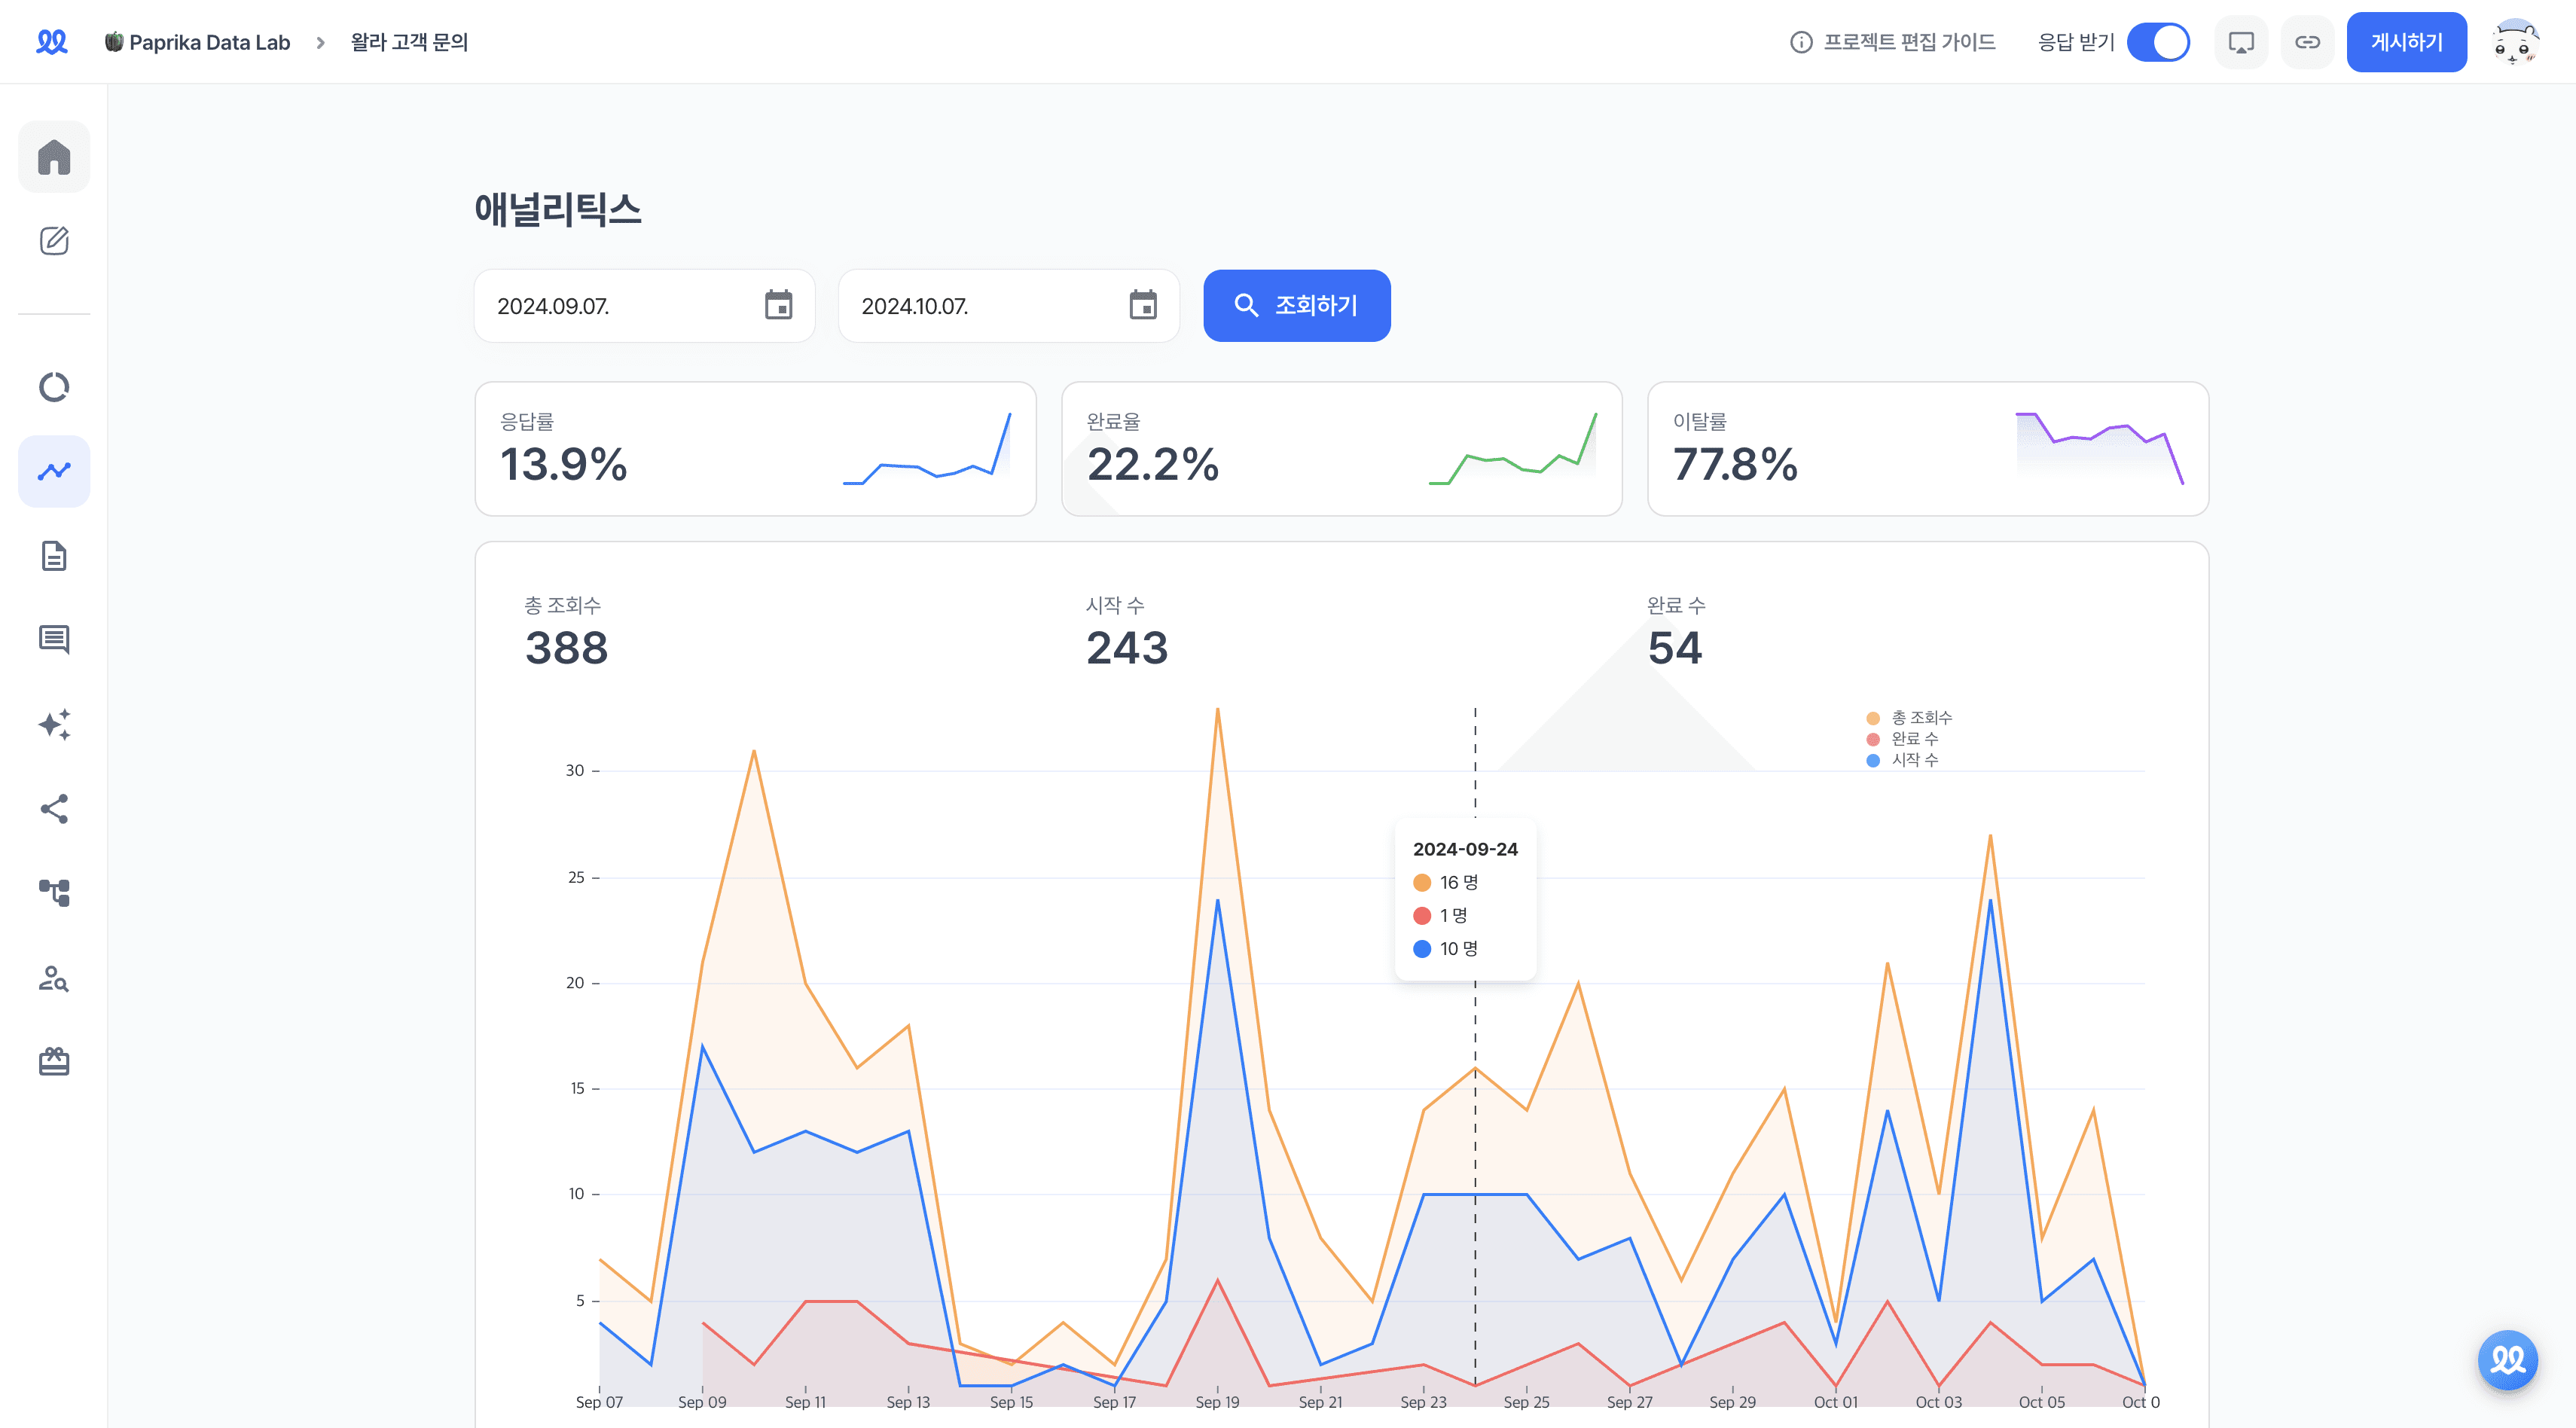
Analytics
Pro
✏️ In Analytics, you can view various results from analyzing basic information about the survey.

Period Setting
Set the period you want to analyze to view data results for that specific timeframe.
On the Free plan, you can only view data for the last 5 days. If you wish to analyze older data, please subscribe to a paid plan.
Provided Data
Response Rate, Completion Rate, Drop-off Rate
Total Views, Start Count, Completion Count
"Views" includes all visits to the URL, even from repeated accesses.
"Start Count" refers to the number of times the survey began, indicated by a button click or scroll action.
Field-wise Views
Field-wise Drop-off Counts
Field-wise Average Time Spent
Daily Average Time Spent
Drop-off Respondents
In Drop-off Respondents, you can see where respondents left the form and how far they progressed.
You can track progress through Drop-off Respondents at the bottom of the 'Analytics' tab.
Blue: The respondent visited this question.
Light Blue: The respondent did not visit this question.
Red: The respondent dropped off at this question.
Example:
Blue-Light Blue-Light Blue-Red: The respondent navigated from question 1 to question 4 via logic, then dropped off.
Red-Blue-Light Blue-Blue: The respondent visited questions 1 and 2, then, via logic, moved to question 4, and dropped off at question 1.
You can click the displayed icons to change the viewing mode or save the table.
Fullscreen Toggle: View the drop-off respondents table in fullscreen.
Hide/Show Columns: Select only the questions you want to view.
Download: Download the selected rows as a CSV file.
Sort: Sort rows in ascending or descending order based on the selected item.


