Editorial

Editorial

Editorial

To You Who Has Been Staring at Data for 10 Hours

To You Who Has Been Staring at Data for 10 Hours

To You Who Has Been Staring at Data for 10 Hours

January 23, 2024

January 23, 2024

January 23, 2024

Freedom in Data Collection and Analysis

Walla’s mission is to create a world where everyone can handle data more easily. When it comes to the task of ‘handling data’, it can broadly be divided into two key phases: ‘data collection’ and ‘data analysis’. Many well-known form builders primarily focus on the ‘data collection’ phase, offering diverse response fields, well-made templates, and customizable designs.


Of course, Walla also aims for efficient data collection. Offering over 20 response fields, providing privacy consent forms, and ensuring a simple and clear design are all part of our efforts.


However, if someone were to ask where Walla's core value lies, the answer undoubtedly lies in the ‘data analysis’ part. This is due to the inefficiencies in the data analysis processes that companies are currently experiencing. Think back to when you received open-ended responses through surveys, questions like ‘Please share your thoughts for improvement’ or ‘Share your feedback and inquiries’. These are questions we've all encountered. Dealing with a few dozen responses can be managed in an hour or two, but the real challenge arises when we look at businesses.


In the case of customer satisfaction surveys, companies receive a staggering number of responses every month, ranging from tens of thousands to nearly a hundred thousand. For event feedback, the numbers can range from 200,000 to 500,000 on average. Walla has encountered researchers who spend over 15 hours on data analysis alone.


Analyzing every response manually and deriving meaningful insights is nearly impossible. Therefore, most companies adopt a strategy of selectively addressing open-ended responses. This traditional, time-consuming, and limited approach to data analysis is the reason why Walla is so dedicated to make ‘data analysis’ more efficient.


A World Without Wasted Data

Walla believes that in a business where data is used effectively, it can experience more efficient growth; and that in a world without wasted data, better decision-making becomes possible. In our effort to bring this world closer, Walla presents its cornerstone service: ‘Open-ended Response Analysis’.


  1. Reading Emotions in Data

Walla automatically categorizes the emotions contained in tens of thousands of responses received from customer inquiries. There are no fixed criteria for response categorization; it can be customized according to the company's requirements. The most common categorization includes four categories: ‘positive’, ‘negative’, ‘neutral’, and ‘irrelevant’. Here are some examples:


  • ‘This product is absolutely fantastic!’ ⇒ Positive

  • ‘I was disappointed with the service.’ ⇒ Negative

  • ‘It could be okay.’ ⇒ Neutral

  • ‘...’ , ‘ㅇㅇㅇㅇㅇ’ ⇒ Irrelevant


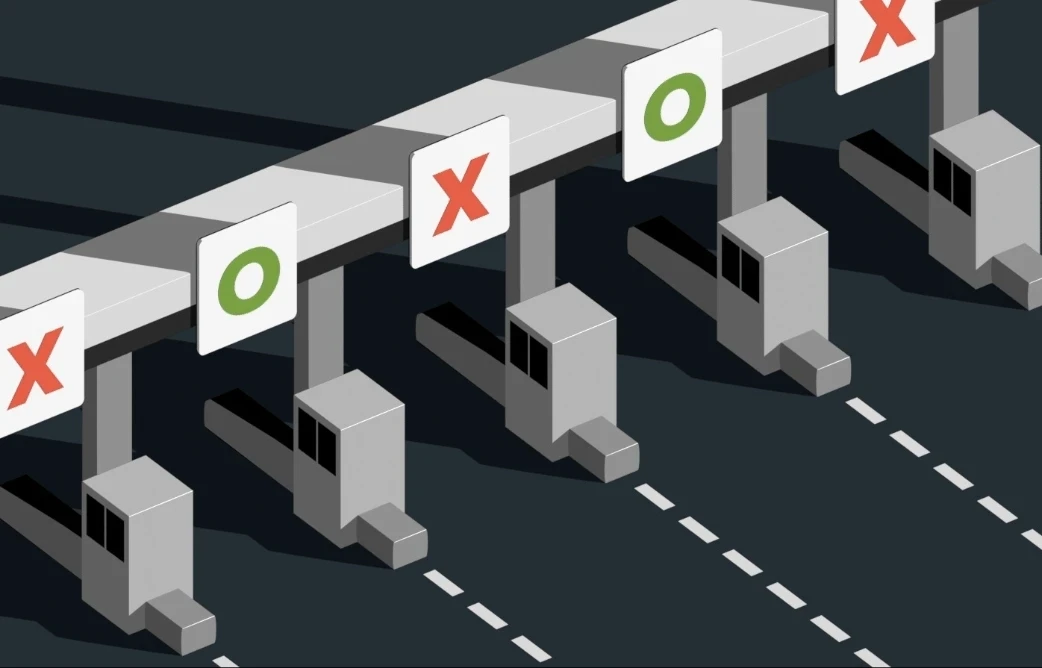
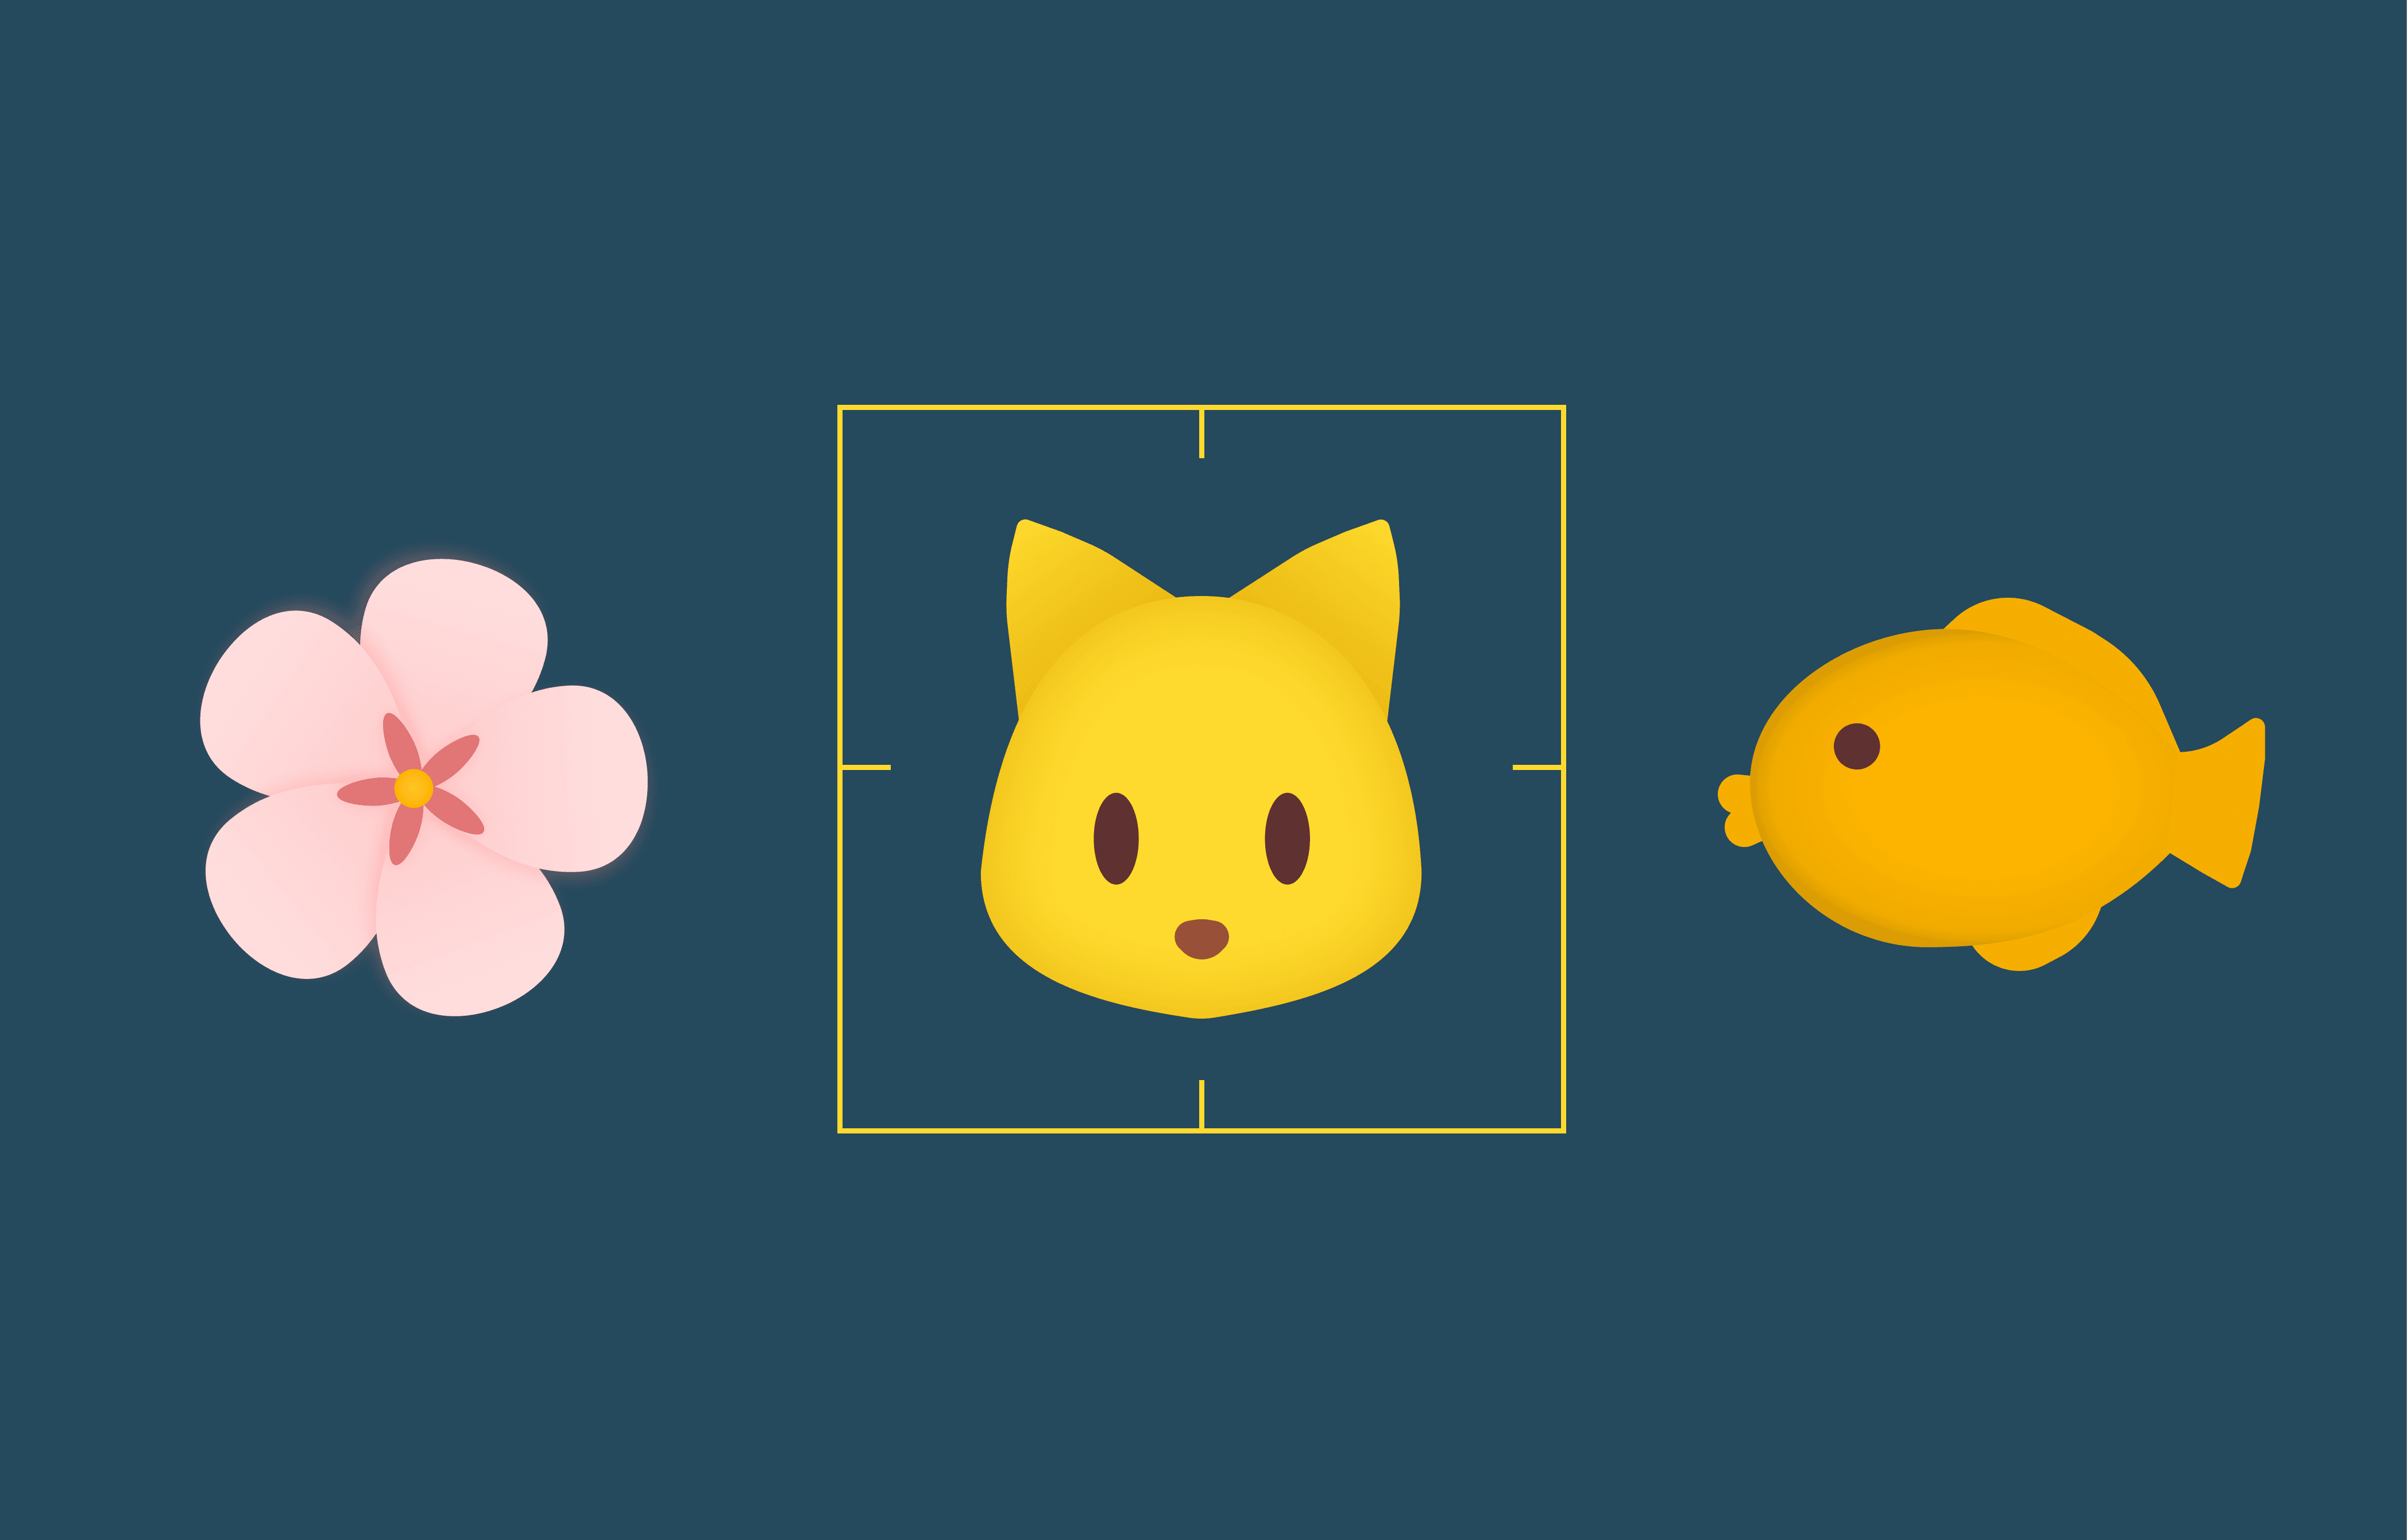
Walla uses natural language processing (NLP) and machine learning techniques for this categorization. It translates incoming open-ended responses into a format understandable by computers, and calculates the distance between learned emotions (positive, negative, etc.) and new data. In this way, Walla conducts emotion categorization.


Categorizing responses by emotions also clarifies their use. Positive responses help companies identify which services excite customers and which features to maintain or enhance. Negative responses provide insights into areas for improvement. This becomes the simplest and clearest classification system for processing customer feedback.


  1. Reading Situations in Data

Walla not only categorizes emotions but also situational context. How is this possible?


The language model that Walla uses differentiates every situation and context in the world into 1,536 dimensions. Responses with similar meanings end up in close positions within this dimensional space. Just like emotion categorization, response distances are used to determine categorization. For instance, a situation where a customer requests a refund due to a service malfunction will be closer in distance to situations where customers express dissatisfaction due to functional issues, rather than situations where they praise the service.


By grouping dimensions based on distance and assigning names like ‘refund’, ‘improvement suggestion’, ‘praise’, or ‘error report’ to those dimensions, open-ended response categorization is completed. Companies can either provide predefined categorization criteria (supervised learning categorization) or simply request clustering based on response distances without predefined categorization criteria (unsupervised learning categorization).


Walla's response categorization technology has numerous applications. Departments such as technical support, marketing, and strategic planning can divide responses and clearly allocate responsibilities. You can also categorize responses based on job positions or subsidiaries.


A Story That Will Soon Be Commonplace

In one company that conducts customer satisfaction surveys through Walla, data is minimized using a dual categorization system based on emotions and situations. For example, when an open-ended response like ‘I'm worried my password might be leaked’ is received, Walla first classifies the emotion in the response as ‘negative’ and then categorizes the department as ‘security’. With this feedback, the security department can focus more on customer data protection.


In line with the goal of ‘freedom in data collection and analysis,’ Walla's technology truly liberates people from manual open-ended response analysis. Customer experience teams at companies using Walla are no longer tied to simple data processing tasks but are dedicating their energy and expertise to more complex and creative problem-solving. Cost-effectiveness regarding the time and effort spent on open-ended response analysis and the fees paid to researchers becomes a natural outcome.


The future of data analysis that Walla is changing is, in fact, a story that will soon become commonplace. We believe it is an essential efficiency that can confidently be recommended for better decision-making and faster growth. Right now, we are at the beginning of that inevitability.


Walla's ‘Open-ended Response Analysis’ service is available in the Enterprise plan. Please contact admin@paprikadatalab.com for inquiries!


  • Edit 김다영 | This content was written by Dayeong Kim from Paprika Data Lab.

  • This content was created as of January 23, 2024.

Get Started

Continue Reading

Continue Reading

Continue Reading

Editorial

Insights from Location Data

March 12, 2024

Editorial

Paprikan Canada Voyage : Inside and Beyond

February 16, 2024

GUIDES

The Marketer's Ace: Hidden Fields

February 14, 2024

Editorial

To You Who Has Been Staring at Data for 10 Hours

January 23, 2024

Editorial

The Secret to Acquiring 30,000 Users with Minimal Marketing Budget

November 29, 2023

Editorial

Paprikan's Open Hiring Journey

November 28, 2023

Guides

Survey Form Webhook Guidelines

August 31, 2023

Editorial

Starting a Company and Living Together in Canada

June 12, 2023

Guides

Let's Group Data Using the Group By Feature

May 17, 2023

Editorial

The Tiny History of Walla

May 15, 2023

Editorial

Insights from Walla Team's Remarkable 220x Revenue Growth in Just 6 Months

April 28, 2024

Editorial

Insights from a Walla Team Co-founder Shared in a University Lecture

April 5, 2023

Guides

How to Create a One-Page Survey

April 5, 2023

Guides

How to Set Up Notifications for Surveys

April 5, 2023

Editorial

A Letter to Aspiring Entrepreneurs

March 29, 2023

Editorial

Why Walla Became Walla: The Story Behind the Name

March 21, 2023

Guides

The Perfect Way to Collect Location Data

March 15, 2023

Guides

Fully Understand Logic Setting

March 14, 2023

Guides

Exploring Walla Team's Philosophy Behind Pricing

March 14, 2023

GUIDES

Analyzing Response Sheet Data with GPT

March 8, 2023

Guides

The Most Efficient Way to Use Google Forms

March 8, 2023

Guides

Hidden Fields: How to Stop Hiding and Start Using

March 8, 2023

Editorial

Hello, It's Team Walla

March 10, 2023

Editorial

Why is it called Paprika Data Lab?

March 10, 2023

Editorial

Insights from Location Data

March 12, 2024

Editorial

Paprikan Canada Voyage : Inside and Beyond

February 16, 2024

GUIDES

The Marketer's Ace: Hidden Fields

February 14, 2024

Editorial

To You Who Has Been Staring at Data for 10 Hours

January 23, 2024

Editorial

The Secret to Acquiring 30,000 Users with Minimal Marketing Budget

November 29, 2023

Editorial

Paprikan's Open Hiring Journey

November 28, 2023

Guides

Survey Form Webhook Guidelines

August 31, 2023

Editorial

Starting a Company and Living Together in Canada

June 12, 2023

Guides

Let's Group Data Using the Group By Feature

May 17, 2023

Editorial

The Tiny History of Walla

May 15, 2023

Editorial

Insights from Walla Team's Remarkable 220x Revenue Growth in Just 6 Months

April 28, 2024

Editorial

Insights from a Walla Team Co-founder Shared in a University Lecture

April 5, 2023

Guides

How to Create a One-Page Survey

April 5, 2023

Guides

How to Set Up Notifications for Surveys

April 5, 2023

Editorial

A Letter to Aspiring Entrepreneurs

March 29, 2023

Editorial

Why Walla Became Walla: The Story Behind the Name

March 21, 2023

Guides

The Perfect Way to Collect Location Data

March 15, 2023

Guides

Fully Understand Logic Setting

March 14, 2023

Guides

Exploring Walla Team's Philosophy Behind Pricing

March 14, 2023

GUIDES

Analyzing Response Sheet Data with GPT

March 8, 2023

Guides

The Most Efficient Way to Use Google Forms

March 8, 2023

Guides

Hidden Fields: How to Stop Hiding and Start Using

March 8, 2023

Editorial

Hello, It's Team Walla

March 10, 2023

Editorial

Why is it called Paprika Data Lab?

March 10, 2023

Editorial

Insights from Location Data

March 12, 2024

Editorial

Paprikan Canada Voyage : Inside and Beyond

February 16, 2024

GUIDES

The Marketer's Ace: Hidden Fields

February 14, 2024

Editorial

To You Who Has Been Staring at Data for 10 Hours

January 23, 2024

Editorial

The Secret to Acquiring 30,000 Users with Minimal Marketing Budget

November 29, 2023

Editorial

Paprikan's Open Hiring Journey

November 28, 2023

Guides

Survey Form Webhook Guidelines

August 31, 2023

Editorial

Starting a Company and Living Together in Canada

June 12, 2023

Guides

Let's Group Data Using the Group By Feature

May 17, 2023

Editorial

The Tiny History of Walla

May 15, 2023

Editorial

Insights from Walla Team's Remarkable 220x Revenue Growth in Just 6 Months

April 28, 2024

Editorial

Insights from a Walla Team Co-founder Shared in a University Lecture

April 5, 2023

Guides

How to Create a One-Page Survey

April 5, 2023

Guides

How to Set Up Notifications for Surveys

April 5, 2023

Editorial

A Letter to Aspiring Entrepreneurs

March 29, 2023

Editorial

Why Walla Became Walla: The Story Behind the Name

March 21, 2023

Guides

The Perfect Way to Collect Location Data

March 15, 2023

Guides

Fully Understand Logic Setting

March 14, 2023

Guides

Exploring Walla Team's Philosophy Behind Pricing

March 14, 2023

GUIDES

Analyzing Response Sheet Data with GPT

March 8, 2023

Guides

The Most Efficient Way to Use Google Forms

March 8, 2023

Guides

Hidden Fields: How to Stop Hiding and Start Using

March 8, 2023

Editorial

Hello, It's Team Walla

March 10, 2023

Editorial

Why is it called Paprika Data Lab?

March 10, 2023