Editorial
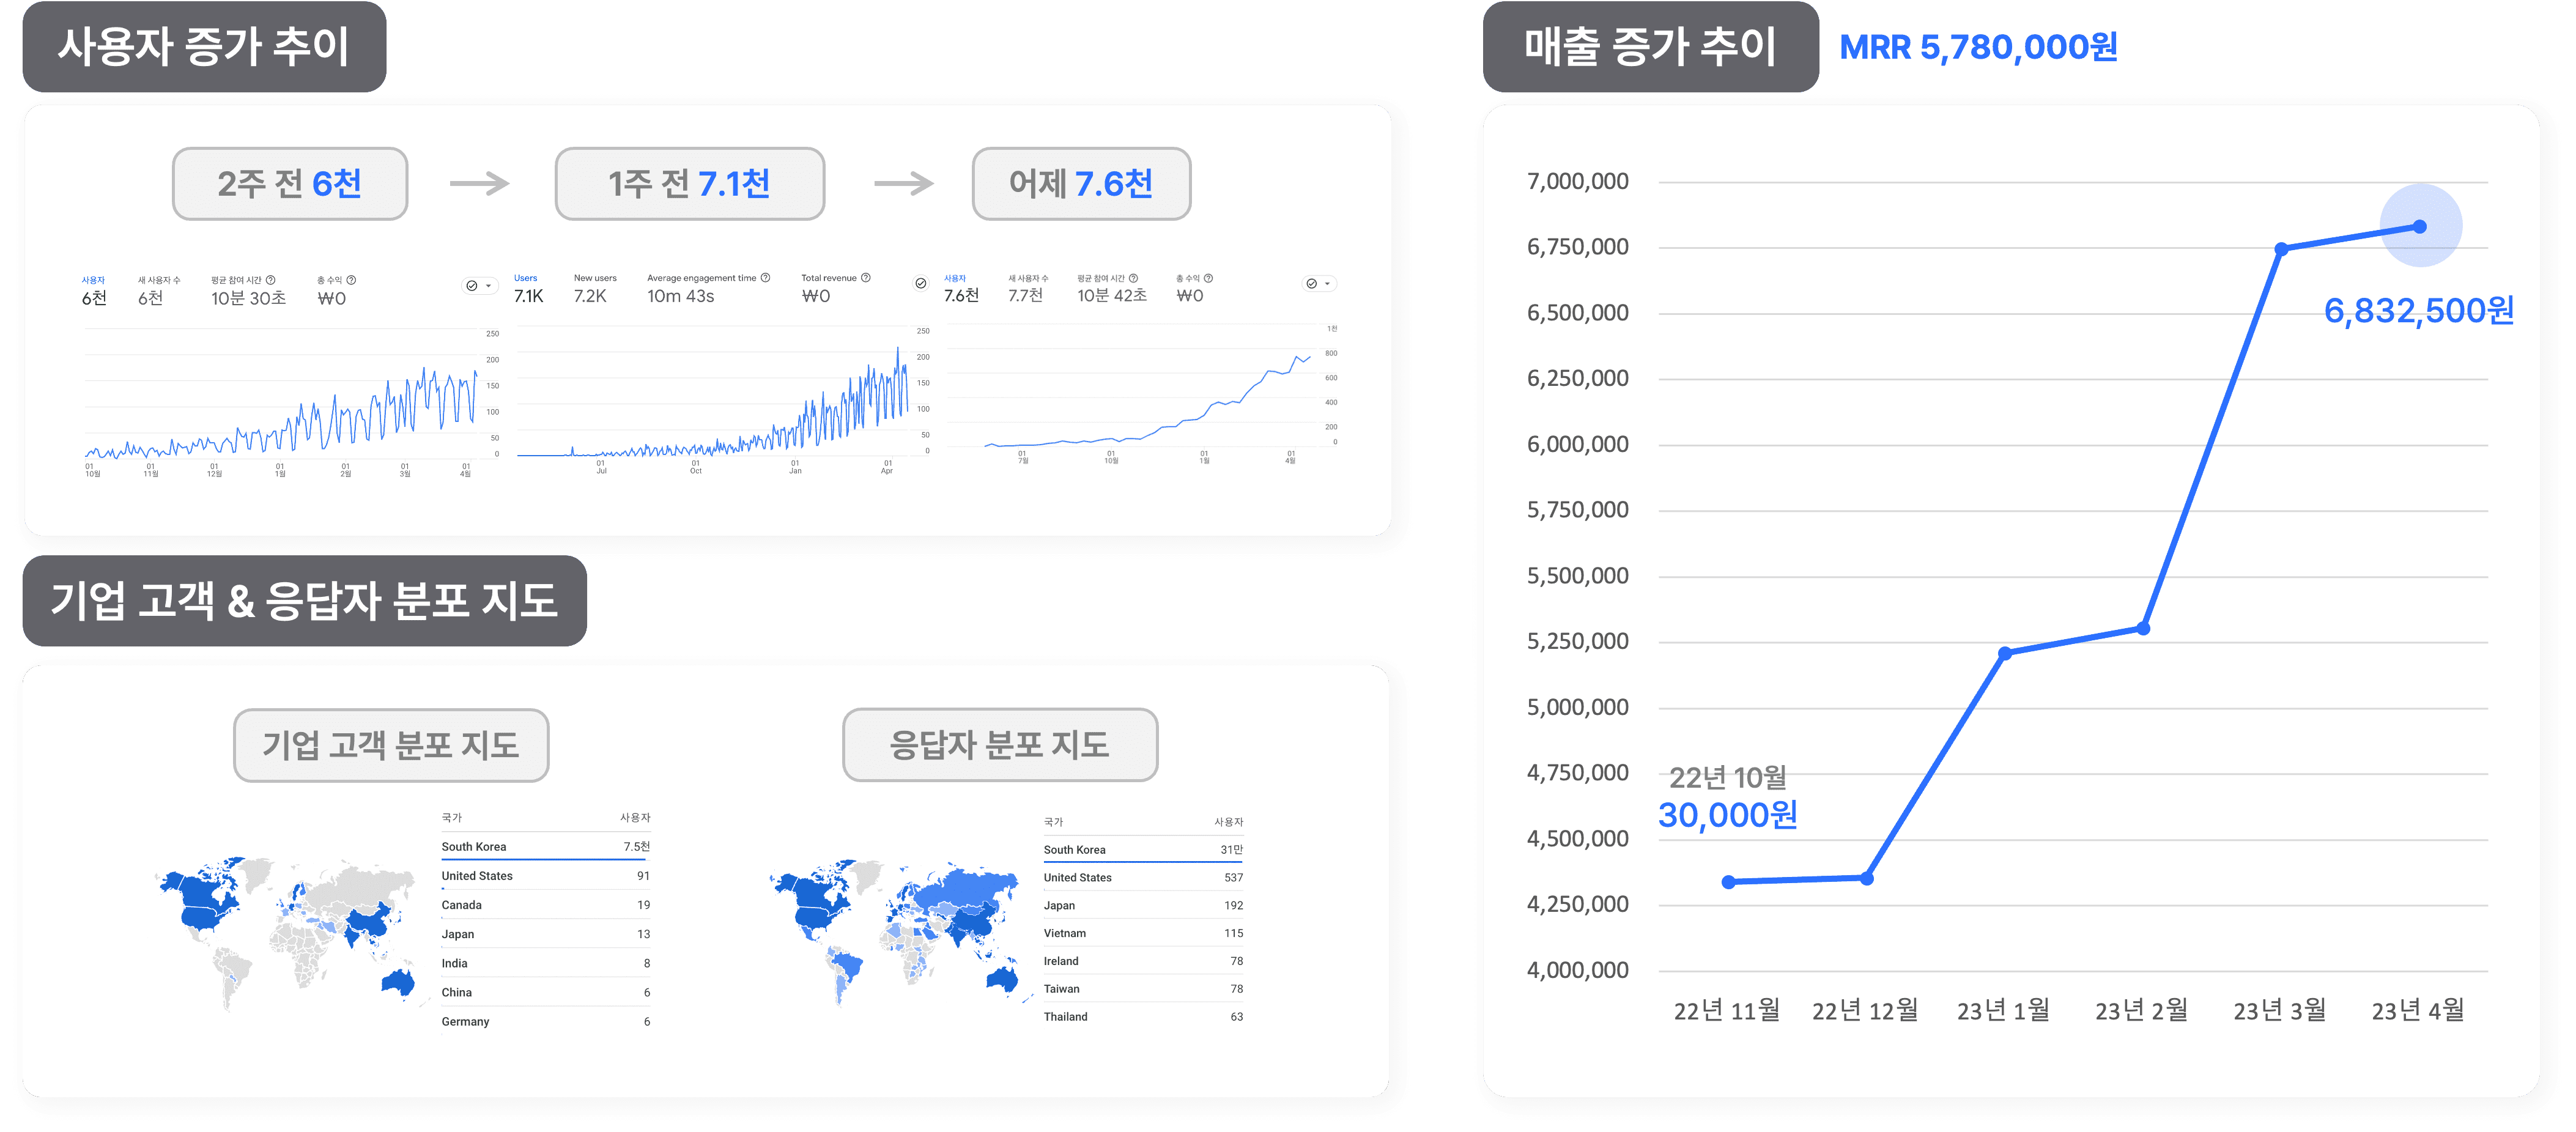
Insights from Walla Team's Remarkable 220x Revenue Growth in Just 6 Months
April 28, 2024


Get Started
Continue Reading

EDITORIAL
Run a Successful Online Promotion with Walla
March 28, 2025

EDITORIAL
Create a Survey in 5 Minutes Using Walla Templates
March 26, 2025

EDITORIAL
Online Event Marketing? Do It All with Just One Survey!
March 21, 2025

EDITORIAL
How to Stay One Step Ahead in B2B Marketing
March 19, 2025

EDITORIAL
Google Forms feels too basic, SurveyMonkey too pricey?
March 14, 2025
EDITORIAL
Perfecting BTL Marketing with Satisfaction Surveys
March 12, 2025

EDITORIAL
Free Marketing Guide for Startups
March 7, 2025
EDITORIAL
Creating Surveys That Elevate Customer Experience (CX)
March 5, 2025
EDITORIAL
Why Walla Is Essential for CRM Analysis
February 21, 2025

EDITORIAL
Ever seen a form like this? A collection of fun and quirky test cases
February 19, 2025
EDITORIAL
Practical Applications of CX, BX, and UX That Professionals Shouldn’t Overlook
February 12, 2025
EDITORIAL
Creating More Aesthetic and Emotionally Engaging Survey Forms with Walla
February 12, 2025

EDITORIAL
Brand Redesign: How to Start with Data
January 31, 2025

EDITORIAL
Comparison of the 4 Major Survey Forms: Naver Form, Typeform, SurveyMonkey, Walla
January 22, 2025

EDITORIAL
A Recent Marketing Research Case Report
January 16, 2025
EDITORIAL
An Overview of the CXO Roadmap through Feedback Analysis
January 9, 2025
EDITORIAL
Boost Your Workflow: Connect Walla to Discord, Slack, and More with Ease
December 9, 2024

EDITORIAL
500 Global Founders Retreat
November 29, 2024
EDITORIAL
Boost Customer Loyalty: How Regular Surveys Drive Better Service and Stronger Brands
December 27, 2024

EDITORIAL
Elevate Your Brand: How Surveys Fuel Awareness and Positive Perception
December 18, 2024

EDITORIAL
Building User-Centric Products: How to Leverage Surveys for Effective Market Insights
December 11, 2024
EDITORIAL
Customer Feedback Management: How South Korea’s Top Brands Drive Growth Through CFM
December 6, 2024

EDITORIAL
Elevating Brand Experience: Why BX Management Defines Market Success
November 27, 2024
EDITORIAL
Crafting High-Impact Customer Surveys: A Roadmap to Better CX
November 20, 2024

EDITORIAL
Beyond Service: How CXM Drives Growth and Competitive Advantage
November 15, 2024

EDITORIAL
Building Strong Starts: Using Feedback to Elevate Employee Onboarding
November 13, 2024
EDITORIAL
Empower Your People: Modern HR & EX Management and the Role of Feedback Tools
November 8, 2024

EDITORIAL
Free but Powerful: The #1 Online Form Builder
November 5, 2024

EDITORIAL
From MP3 Players to Grapefruit Honey Tea: Brands That Thrived With Online Surveys
October 25, 2024

EDITORIAL
From Custom Design to AI Analysis: How Walla Beats Google Forms 120%
October 13, 2024
EDITORIAL
Is Google Forms Enough? Key Drawbacks You Shouldn’t Overlook
October 9, 2024
EDITORIAL
Reimagining Convenience: Walla’s Ready-to-Use Survey Templates for Your Brand
October 2, 2024
EDITORIAL
Google Forms or Walla? A Comprehensive Feature-by-Feature Look
July 23, 2024

EDITORL
Crafting the Perfect Survey: Key Strategies for High-Quality Data
October 6, 2024

EDITORIAL
Revisiting On-Premise: Navigating Your Options Between SaaS and Traditional Setups
October 18, 2024

GUIDES
Manage Capacity Stress-Free: Quota Settings
July 19, 2024
Editorial
Insights from Location Data
March 12, 2024

Editorial
Paprikan Canada Voyage : Inside and Beyond
February 16, 2024

GUIDES
The Marketer's Ace: Hidden Fields
February 14, 2024
Editorial
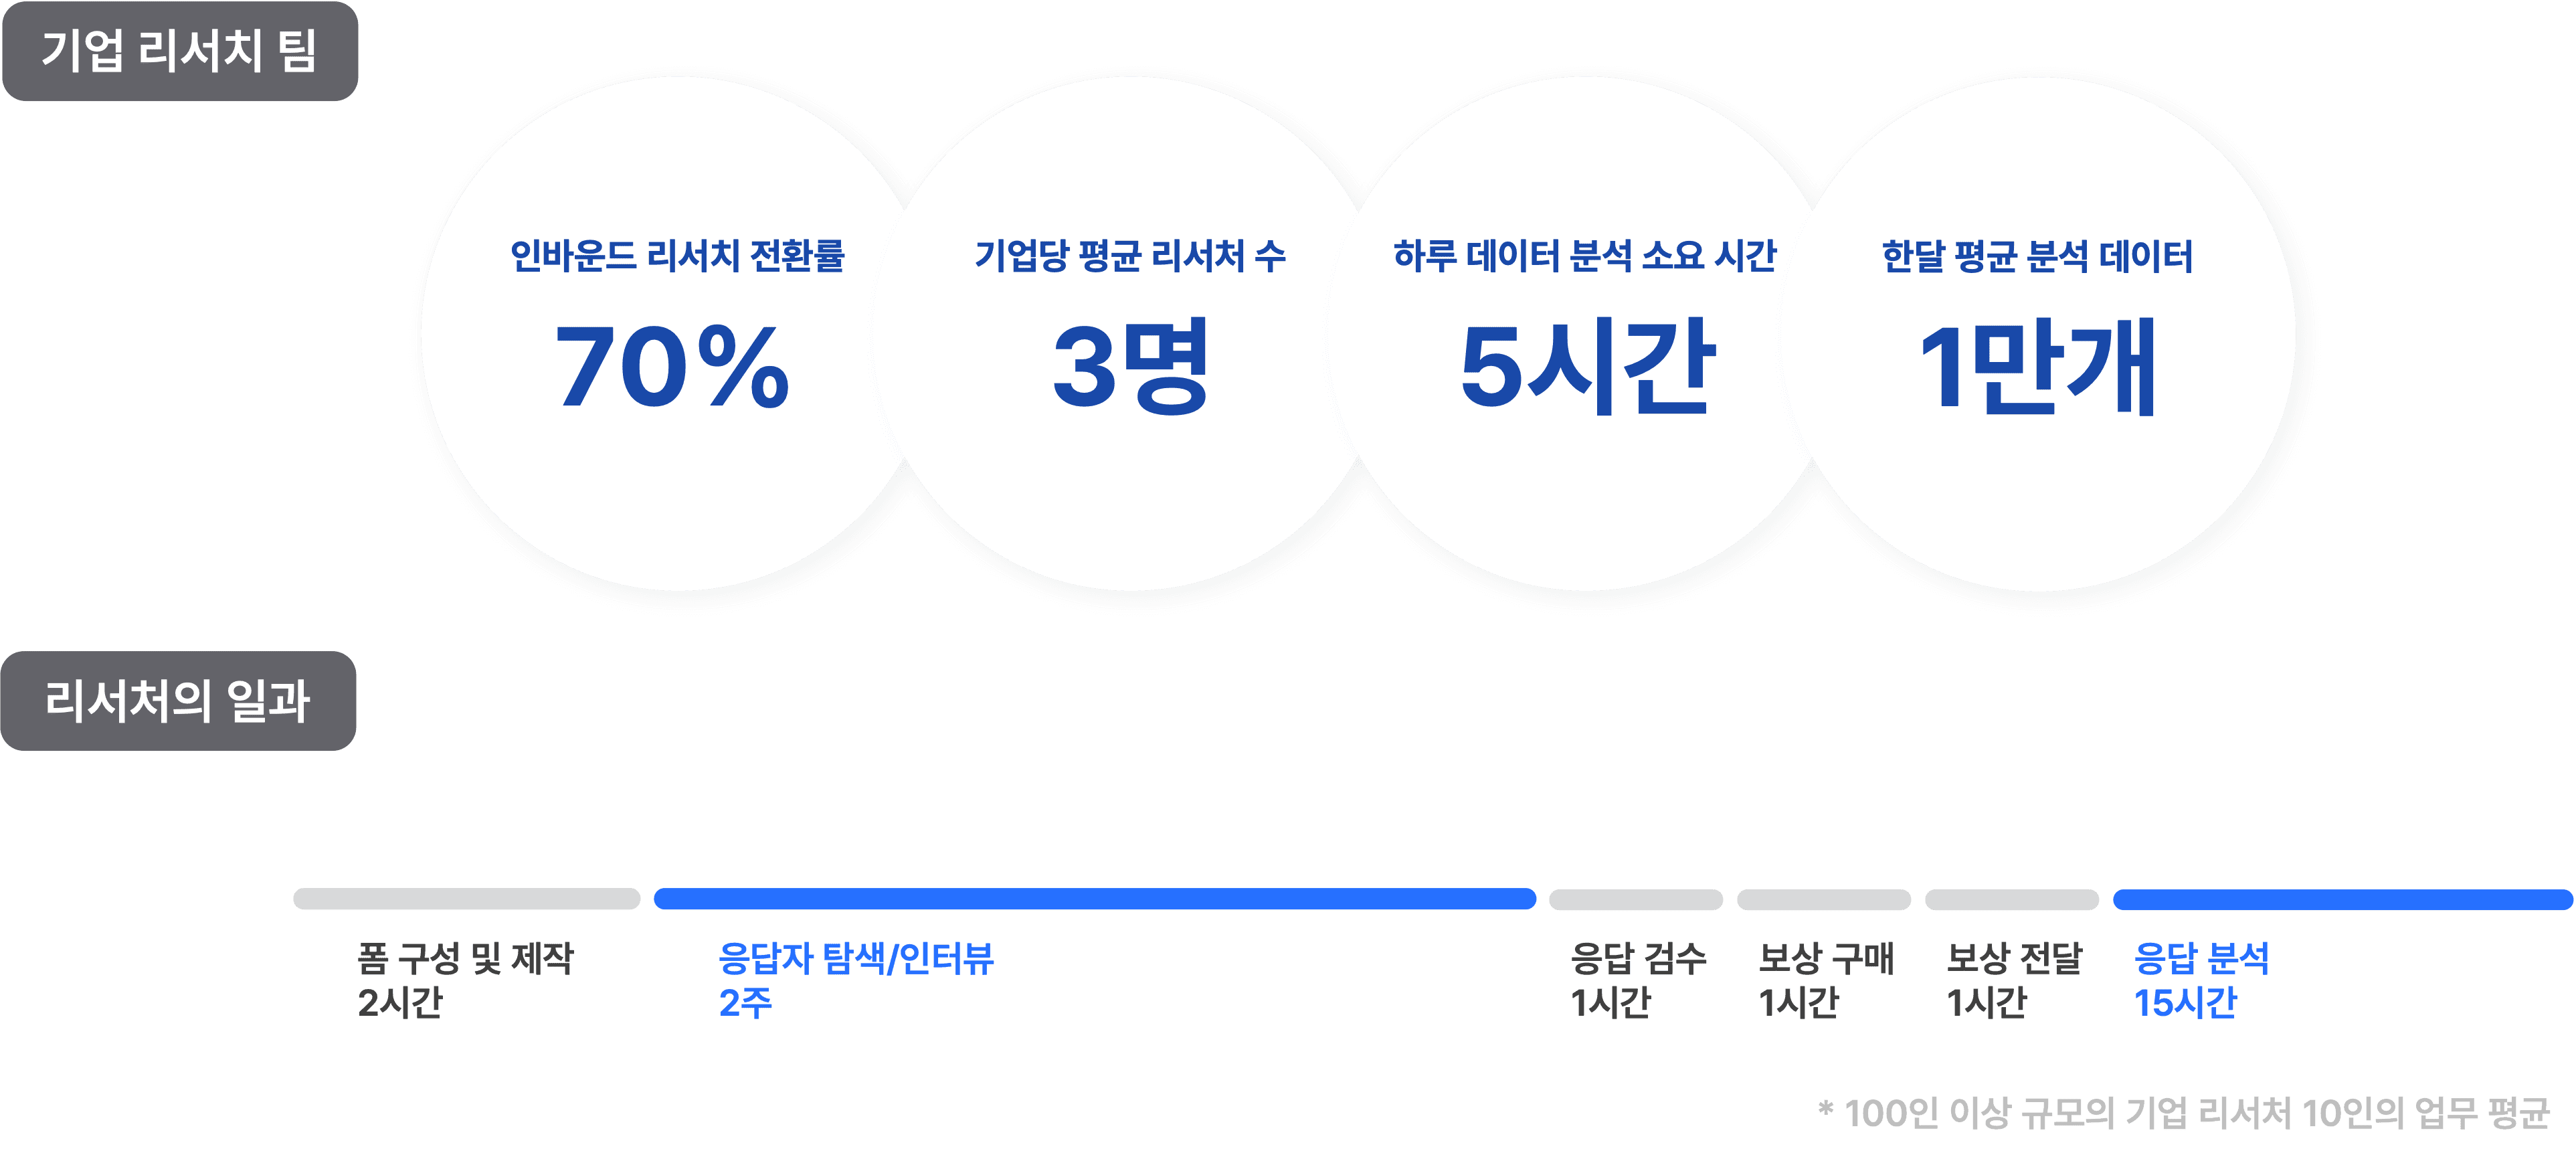
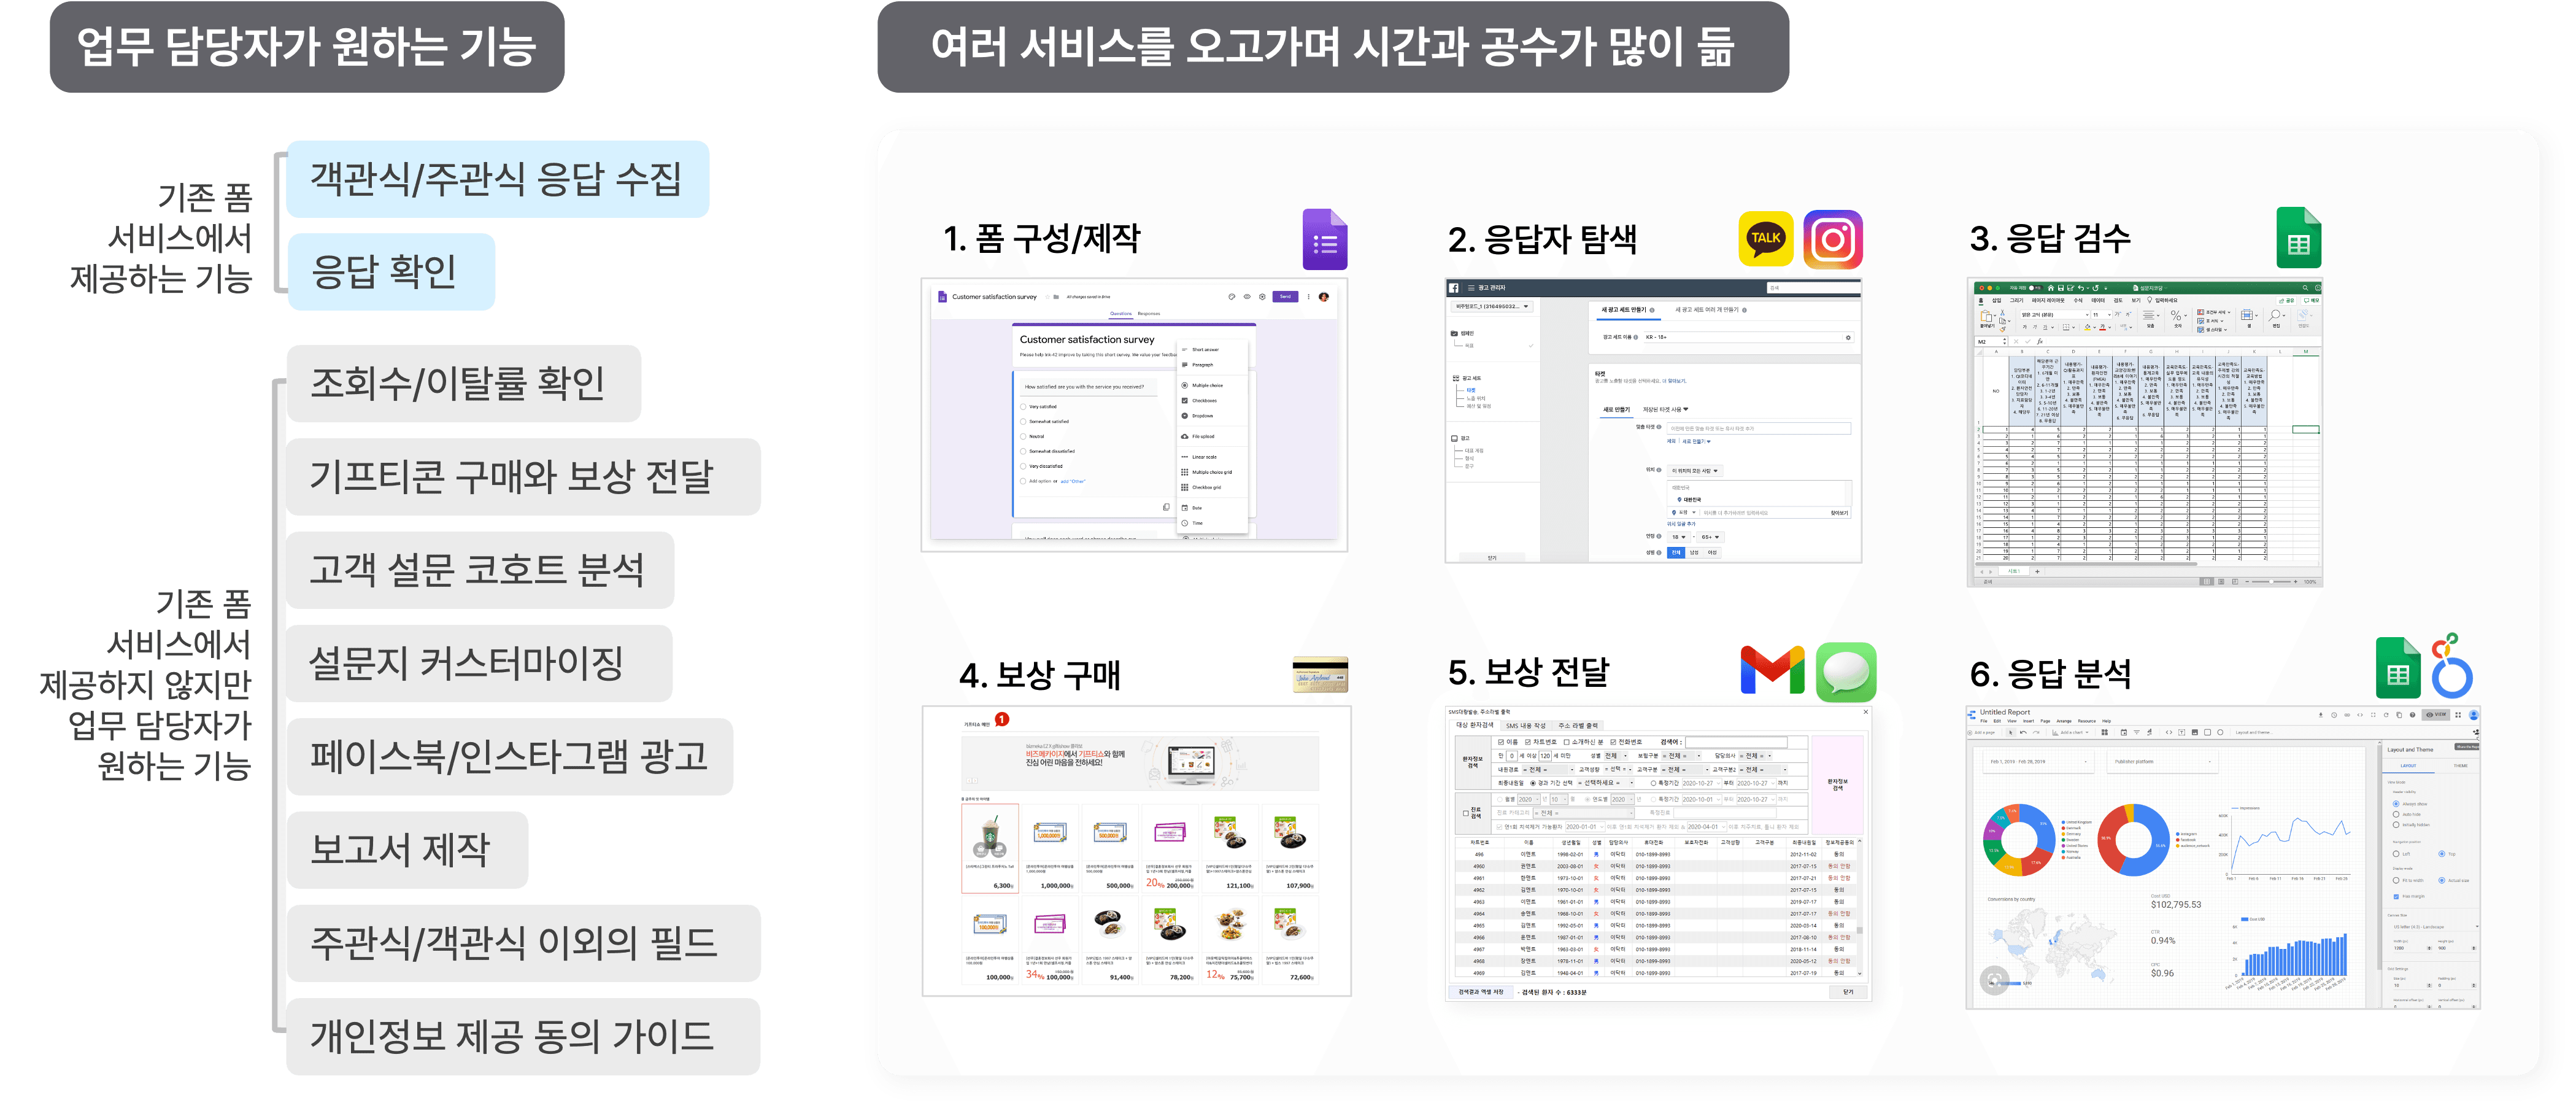
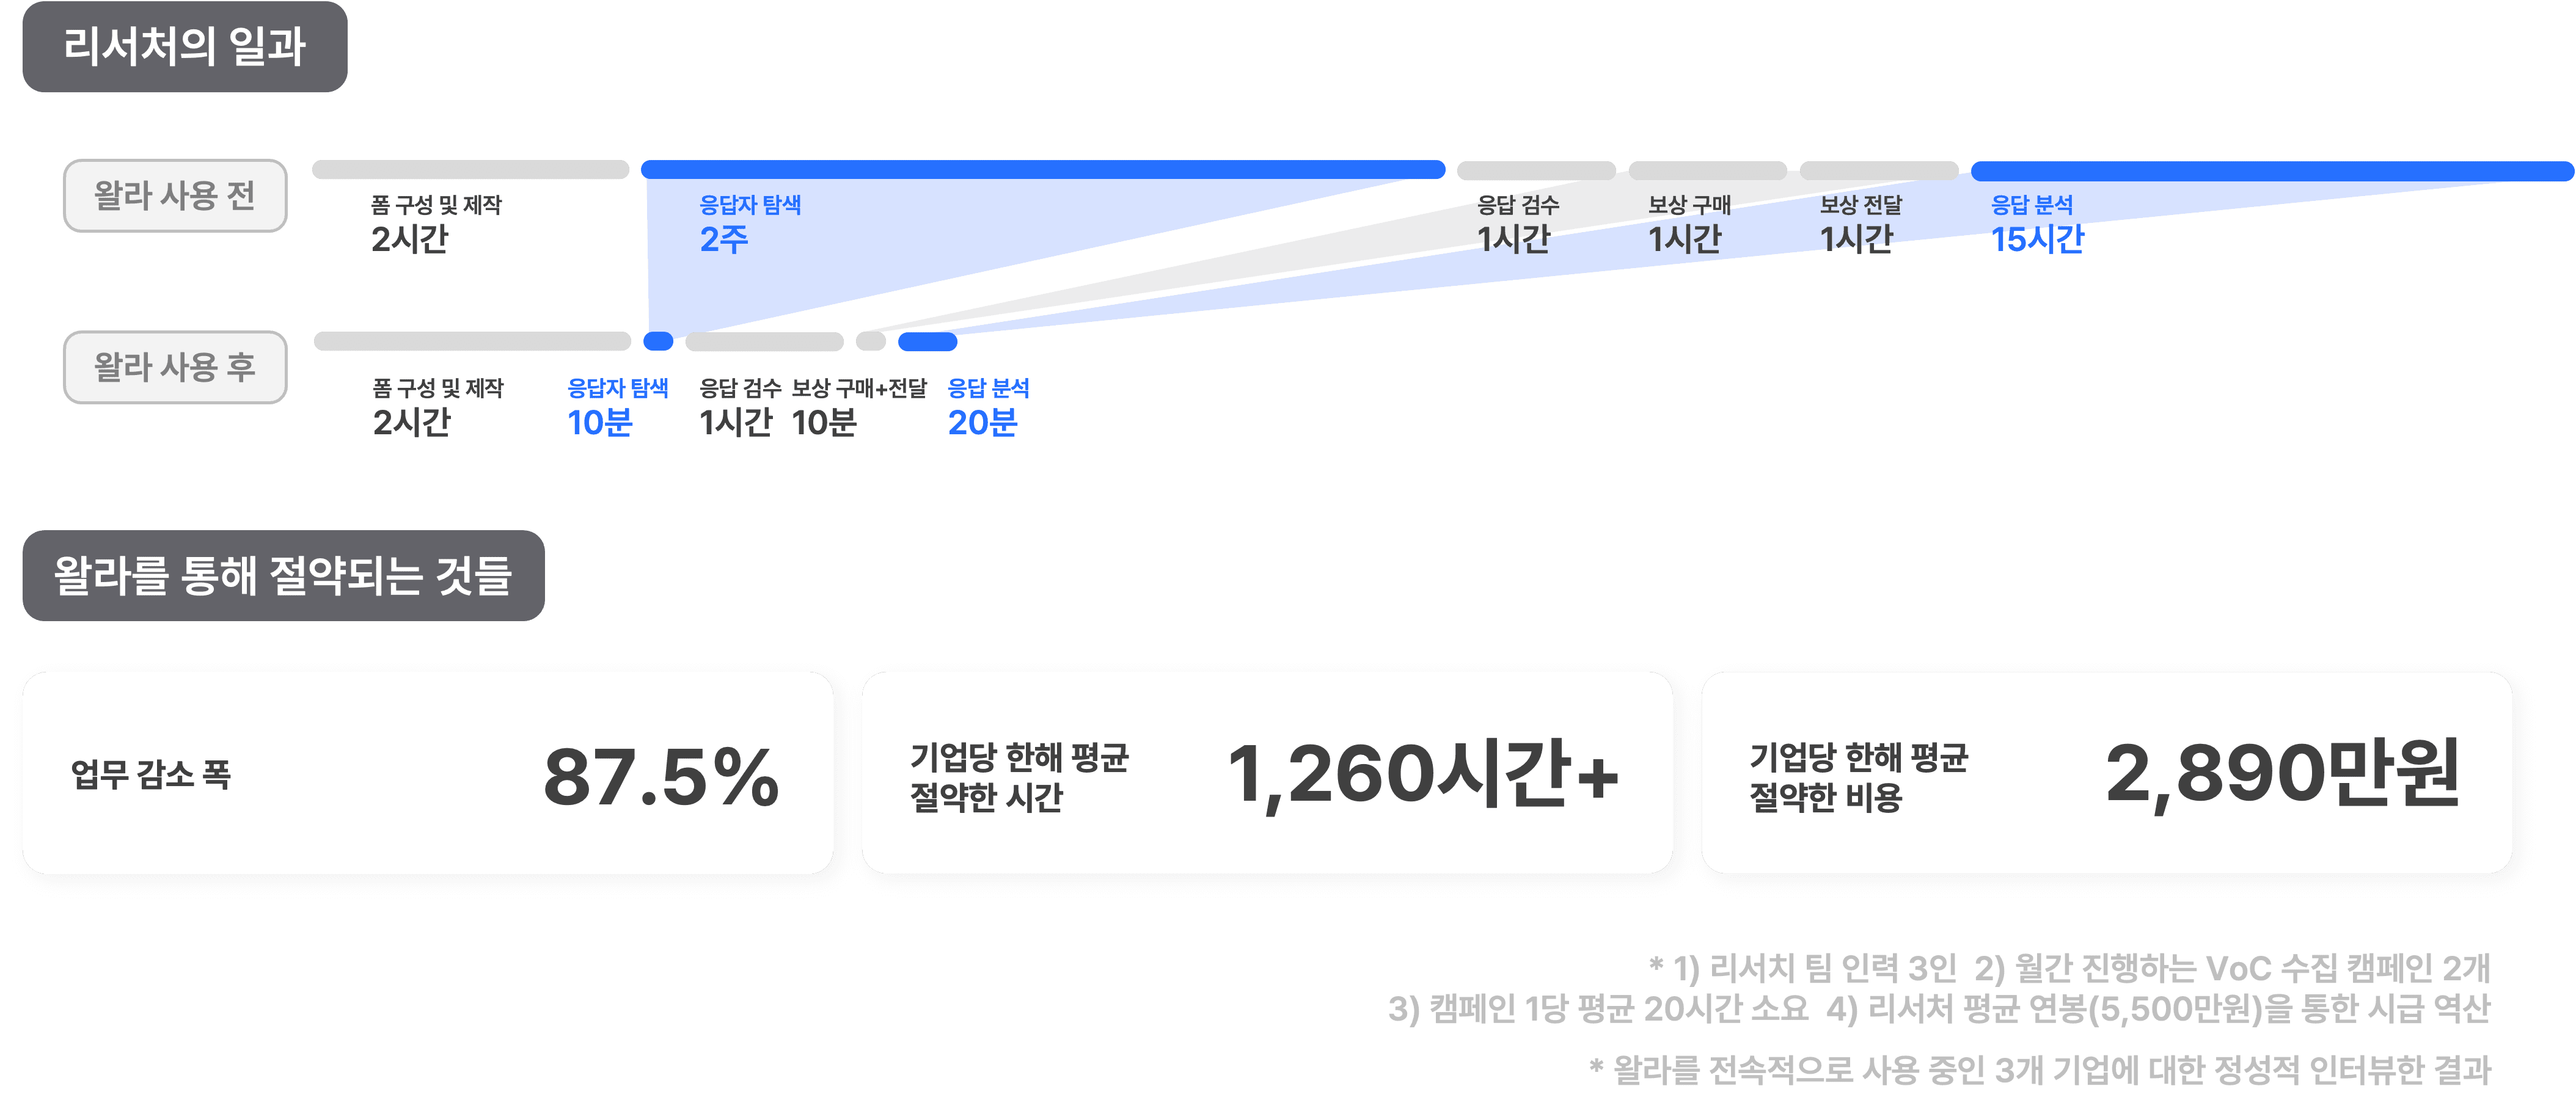
To You Who Has Been Staring at Data for 10 Hours
January 23, 2024

Editorial
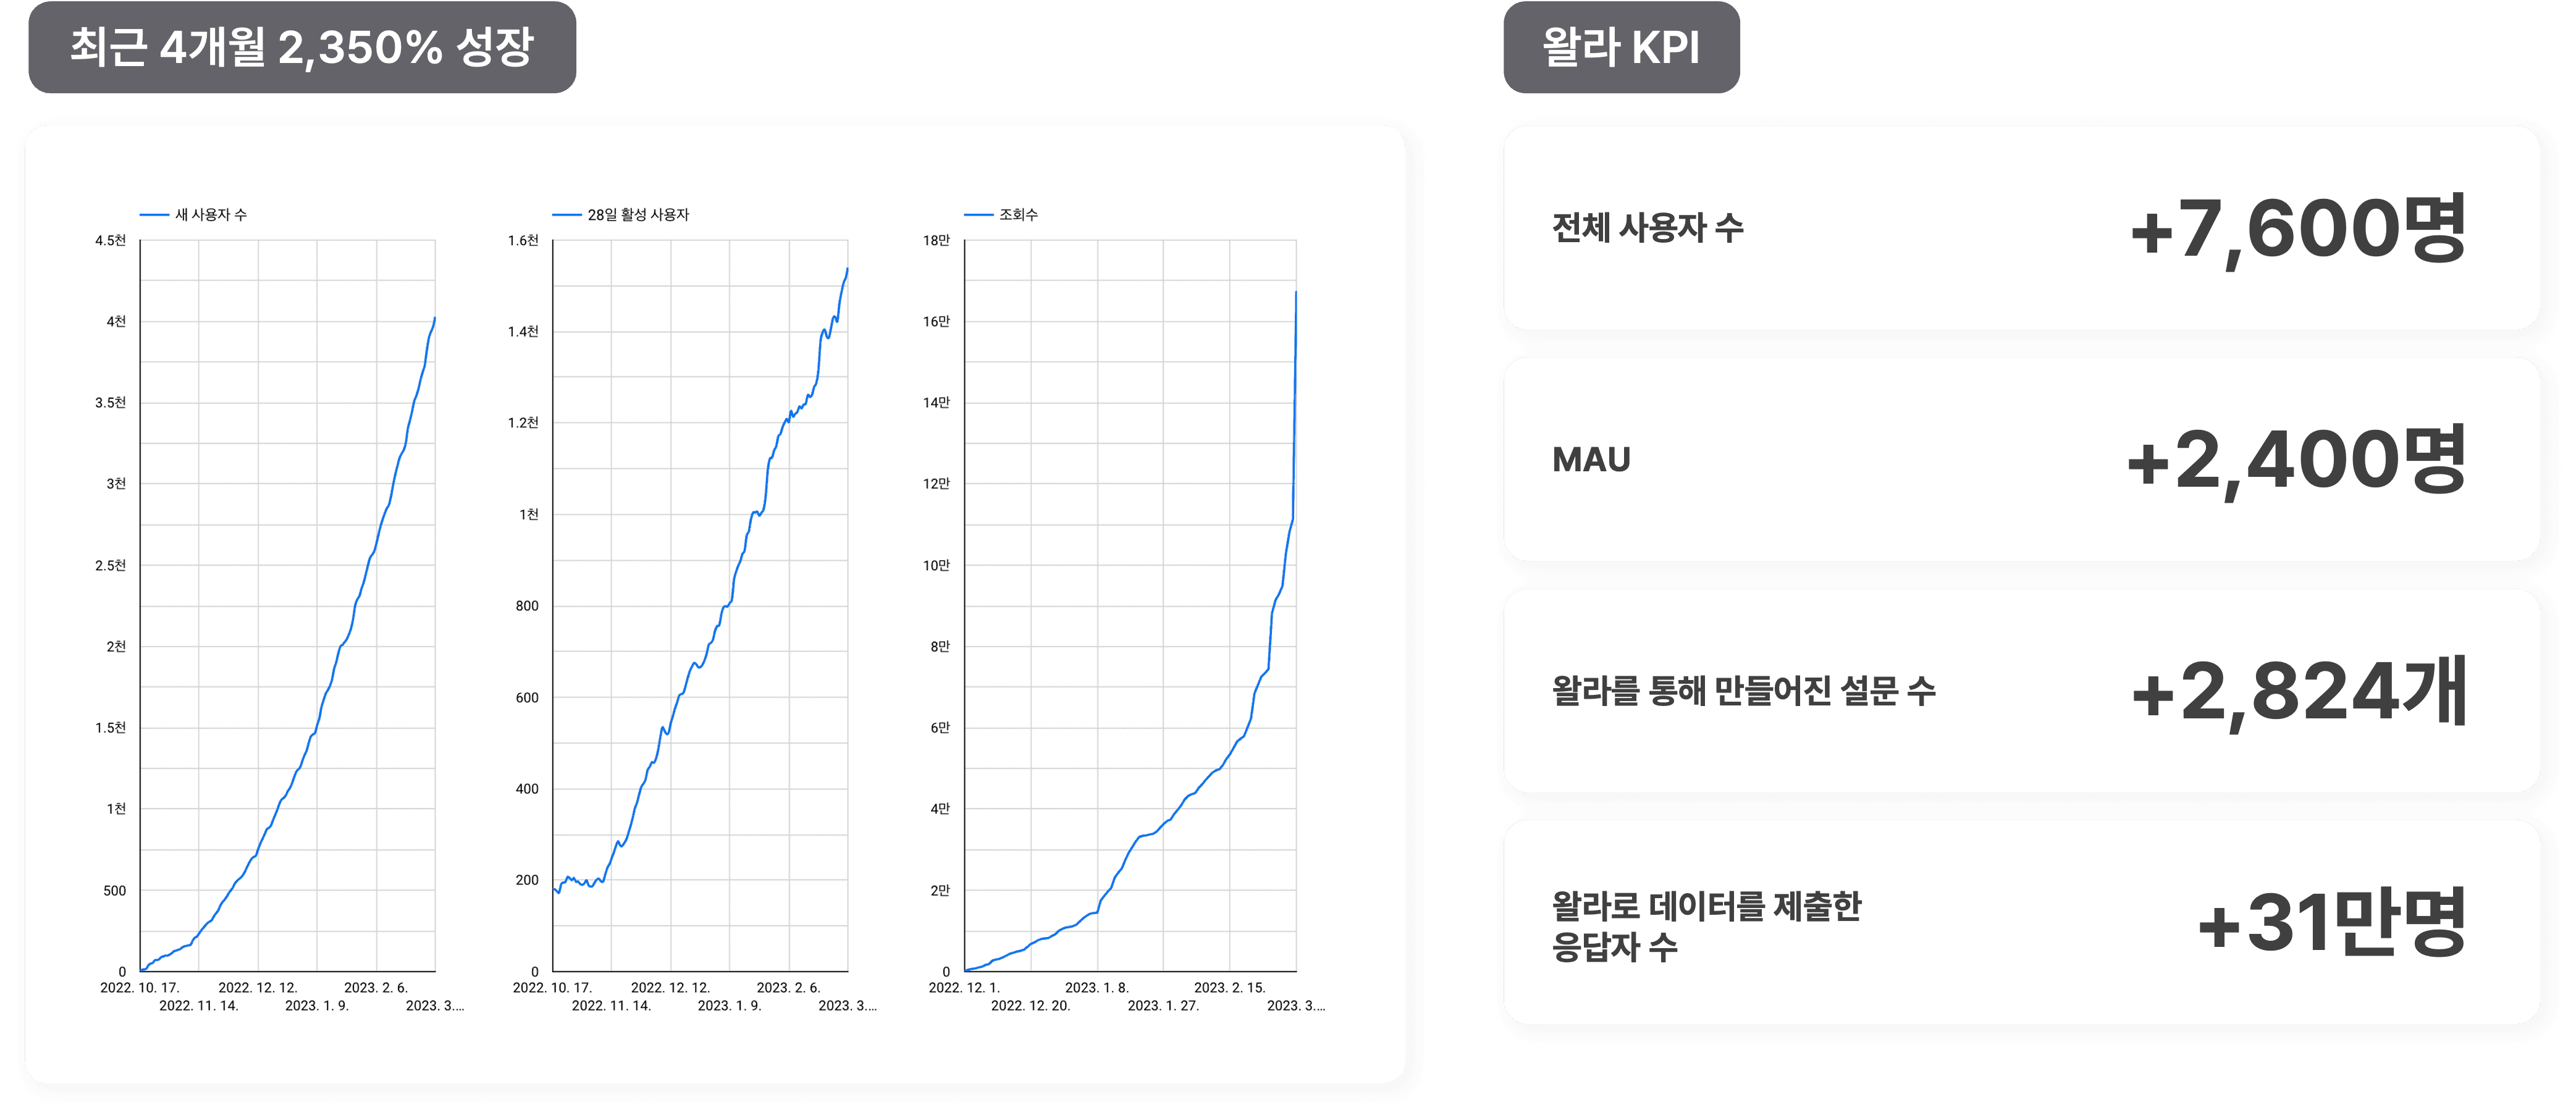
The Secret to Acquiring 30,000 Users with Minimal Marketing Budget
November 29, 2023

Editorial
Paprikan's Open Hiring Journey
November 28, 2023

Guides
Survey Form Webhook Guidelines
August 31, 2023

Editorial
Starting a Company and Living Together in Canada
June 12, 2023
Guides
Let's Group Data Using the Group By Feature
May 17, 2023

Editorial
The Tiny History of Walla
May 15, 2023
Editorial
Insights from Walla Team's Remarkable 220x Revenue Growth in Just 6 Months
April 28, 2024

Editorial
Insights from a Walla Team Co-founder Shared in a University Lecture
April 5, 2023

Guides
How to Create a One-Page Survey
April 5, 2023

Guides
How to Set Up Notifications for Surveys
April 5, 2023

Editorial
A Letter to Aspiring Entrepreneurs
March 29, 2023

Editorial
Why Walla Became Walla: The Story Behind the Name
March 21, 2023

Guides
The Perfect Way to Collect Location Data
March 15, 2023

Guides
Fully Understand Logic Setting
March 14, 2023

Guides
Exploring Walla Team's Philosophy Behind Pricing
March 14, 2023

GUIDES
Analyzing Response Sheet Data with GPT
March 8, 2023

Guides
The Most Efficient Way to Use Google Forms
March 8, 2023

Guides
Hidden Fields: How to Stop Hiding and Start Using
March 8, 2023

Editorial
Hello, It's Team Walla
March 10, 2023

Editorial
Why is it called Paprika Data Lab?
March 10, 2023